Verificação de Status - Linux
- How to Check CPU Information on Linux?
- How to Check CPU Temperature on Linux
- Comandos IPMITOOL
- Recommended operating range for Core temperature
- O comando HTOP no Linux
How to Check CPU Information on Linux?
Link: https://www.scaler.com/topics/cpu-info-linux/
Overview
Checking CPU information on Linux is an essential task for understanding your system's hardware configuration and capabilities. The CPU (Central Processing Unit) is a crucial component that performs calculations executes instructions, and manages system resources. You can gather details such as the CPU model, architecture, clock speed, number of cores, cache size, and supported features by checking CPU information.
Introduction
Linux provides various methods to get CPU info linux, from simple commands to more advanced tools. These methods offer different levels of detail and flexibility, allowing you to choose the one that suits your needs. By exploring these methods, you can gain valuable insights into your CPU and optimize your system accordingly.
Some commonly used methods to get CPU info linux include using commands like "lscpu," "cat /proc/cpuinfo," "top" or "htop," "nproc," and utilizing tools such as "hardinfo," "hwinfo," "dmidecode," "inxi," and "lshw." Each method provides specific information about the CPU, enabling you to analyze its capabilities and make informed decisions.
To get CPU info linux is beneficial in various scenarios. It helps system administrators understand the system's performance characteristics, identify hardware limitations, and plan resource allocation. Developers and software enthusiasts can utilize CPU information to optimize applications for specific CPU architectures and features. Additionally, troubleshooting performance issues, diagnosing compatibility problems, and monitoring system utilization is also facilitated by checking CPU information.
In the following sections, we will delve into each method to get CPU info linux, providing step-by-step instructions and explanations on how to use them effectively. By understanding these methods, you will be equipped with the knowledge to gather comprehensive CPU information and make informed decisions based on your system's hardware capabilities.
It's important to note that the specific commands and tools mentioned in this guide may vary depending on your Linux distribution. However, the underlying concepts and approaches remain consistent across distributions.
Checking CPU information on Linux allows you to understand the characteristics and capabilities of your system's CPU. It provides crucial insights for system optimization, troubleshooting, and resource allocation. Utilizing various commands and tools in the Linux ecosystem allows you to gather detailed information about the CPU model, architecture, clock speed, cores, cache size, and supported features. With this knowledge, you can make informed decisions to maximize your system's performance and compatibility.
Methods to Get CPU Information on Linux
Using lscpu Command
The lscpu command provides detailed information about the CPU architecture and characteristics. Open a terminal and type:
$ lscpuThis command will display information such as CPU model, CPU family, number of cores and threads, clock speed, and cache size. The lscpu command output is easy to read and provides a concise overview of the CPU's specifications.
Using cat /proc/cpuinfo
The /proc/cpuinfo file contains information about the CPU and its features. Open a terminal and run:
$ cat /proc/cpuinfoThis command will display detailed information about each CPU core, including model name, vendor, cache size, and flags indicating CPU-supported features. The output can be quite extensive, as it provides information for each core on the system.
Using top or htop Command
The top and htop commands are system monitoring tools that provide real-time information about processes and system resources. Open a terminal and type:
$ topor
$ htopLook for the CPU section, which displays CPU usage, load average, and individual core usage information. While these commands primarily focus on process monitoring, they glance at CPU utilization and core performance.
Using nproc Command
The nproc command displays the number of processing units available. Open a terminal and run:
$ nprocThis command will output the total number of CPU cores. It provides a simple way to determine the number of cores without diving into detailed specifications.
Using hardinfo Command
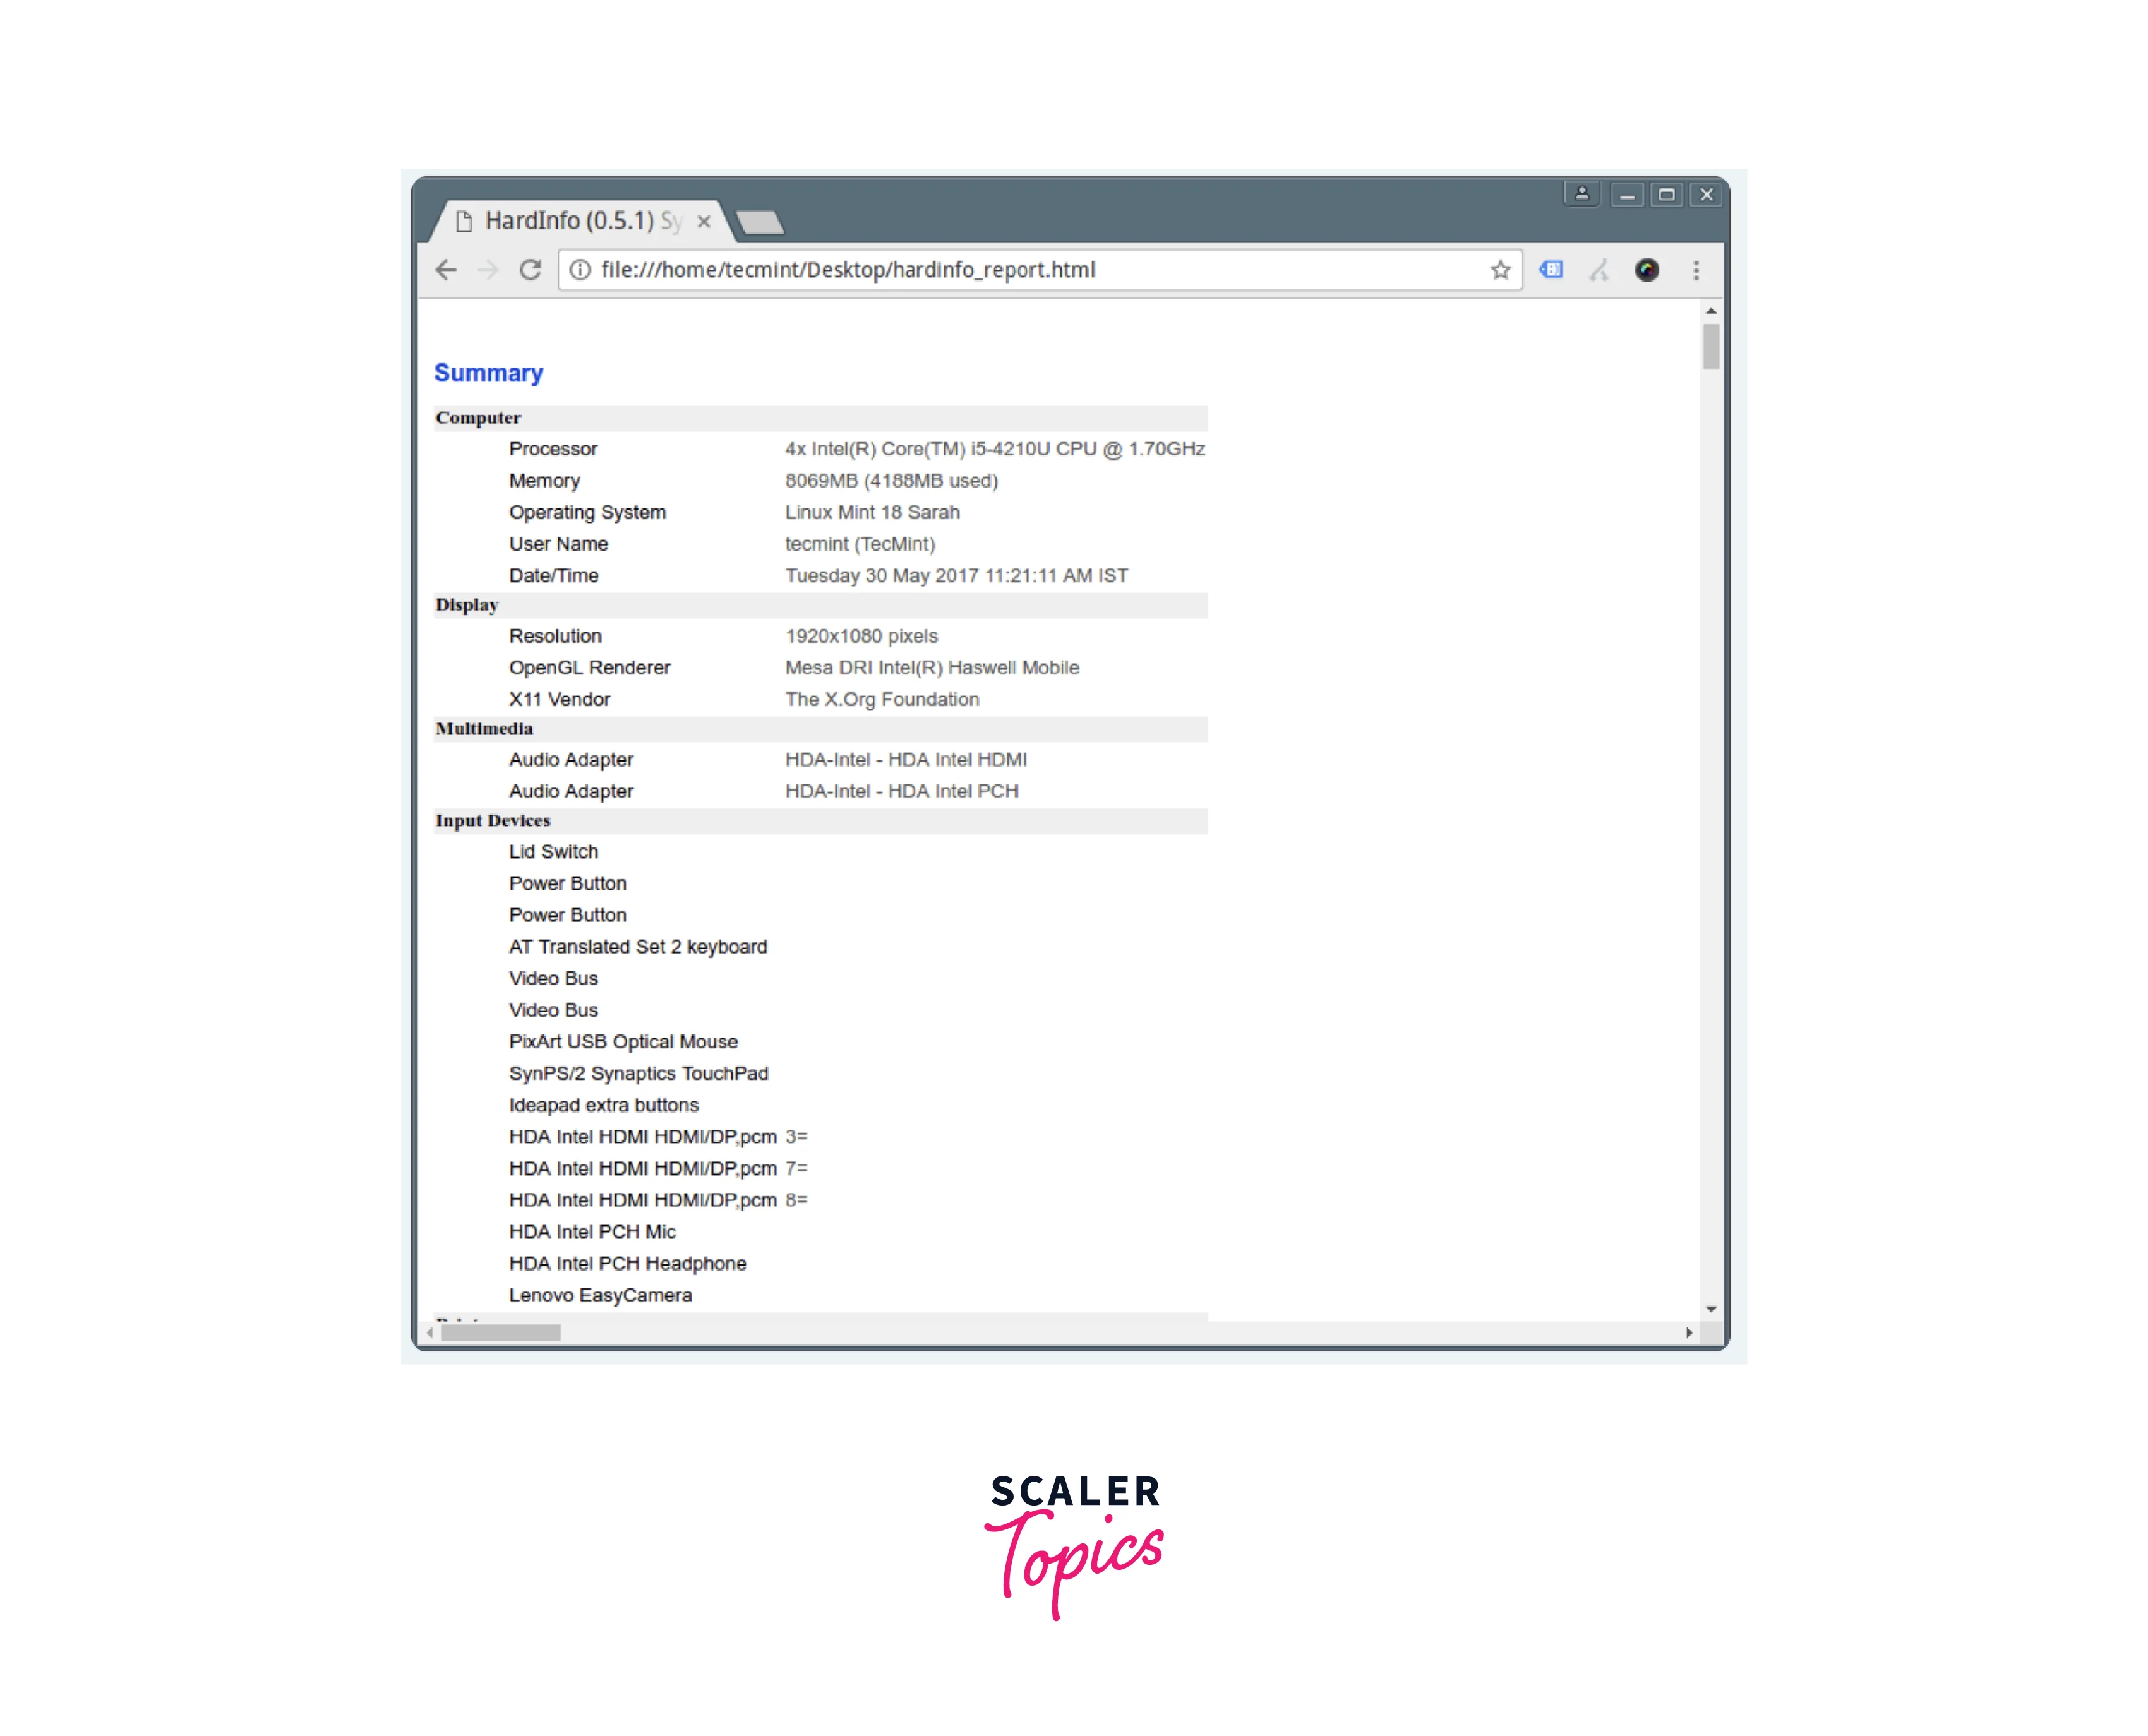
The hardinfo command is a graphical tool that provides detailed information about hardware components, including the CPU. Install it if it's not already available and run:
$ hardinfoNavigate to the "Processor" section to view CPU-related information. And click generate report. Hardinfo offers a user-friendly interface and presents CPU details in an organized manner.

Using hwinfo Command
The hwinfo command is a powerful hardware information tool. Install it if needed and execute:
$ hwinfo --cpuThis command will provide comprehensive information about the CPU, including architecture, clock speed, cache size, and supported features. The output may contain a wealth of information, making it suitable for advanced users and system administrators.
Using dmidecode -t Processor Command
The dmidecode command displays information from the system DMI (Desktop Management Interface) table. Open a terminal and run:
$ sudo dmidecode -t processorThis command will output detailed information about the CPU, such as socket designation, type, family, and characteristics. The dmidecode command extracts information directly from the system's firmware, providing accurate and specific details about the CPU.
Using getconf _NPROCESSORS_ONLN Command
The getconf command retrieves system configuration variables. Open a terminal and type:
$ getconf _NPROCESSORS_ONLNThis command will display the number of online processors or CPU cores. It is a quick way to obtain the core count without requiring extensive CPU information.
Using Inxi Tool
The inxi tool provides a comprehensive system information overview, including CPU details. Install it if necessary and run:
$ inxi -CThis command will display CPU-related information, including model, cache size, clock speed, and other relevant details. Inxi is a versatile tool that offers a wide range of system information, making it useful for various purposes.
Using lshw Tool
The lshw command (Hardware Lister) provides detailed information about the system's hardware configuration. Install it if not already available and execute:
$ sudo lshw -class processorThis command will show detailed information about the processor, including model, vendor, capabilities, clock speed, and more. Lshw generates a comprehensive report that includes various hardware components, making it a valuable tool for system inspection.
Here are some other methods to get Linux CPU info:
1. Using the cpufrequtils Command:
The cpufrequtils package provides utilities for managing CPU frequency scaling. Install it if needed and run:
$ cpufreq-infoThis command will display information about the current CPU frequency scaling settings, including the available scaling governors and the maximum and minimum CPU frequencies.
2. Using the sysfs Filesystem:
Linux provides a sysfs filesystem that exposes information about the system's devices and drivers. Open a terminal and navigate to the "/sys/devices/system/cpu" directory. Inside this directory, you will find subdirectories corresponding to each CPU core. You can access files such as "cpu MHz" to retrieve the current CPU frequency, "cache" to obtain cache-related information, and "cpuinfo_max_freq" to determine the maximum CPU frequency.
3. Using the dmidecode -t 4 Command:
The dmidecode command can also provide information about the CPU sockets available on the system. Open a terminal and run:
$ sudo dmidecode -t 4This command will display information about the physical characteristics of the CPU sockets, including socket designation, type, and more.
4. Using the i7z Tool:
The i7z tool is designed for Intel Core i3/i5/i7 CPUs and provides detailed information about their features and status. Install it if necessary and run:
$ i7zThis command will display CPU temperature, multiplier, core frequency, and more information.
5. Using the sysctl Command:
The sysctl command allows you to view and modify kernel parameters. Open a terminal and run:
$ sysctl -a | grep machdep.cpuThis command will display CPU-related kernel parameters, including features, capabilities, and cache information.
Utilizing these methods lets you easily retrieve CPU information on your Linux system. Each command or tool provides different levels of detail, allowing you to choose the one that best suits your needs. Understanding your CPU's capabilities and specifications can be beneficial for system optimization, troubleshooting, or hardware compatibility purposes.
Whether you prefer a command-line approach or a graphical tool, Linux offers a variety of options to obtain CPU information. These versatile methods cater to different user preferences, making gathering the necessary information for your specific requirements easier.
Checking CPU information on Linux is crucial for understanding your system's hardware configuration and capabilities. By using various commands and tools such as lscpu, cat /proc/cpuinfo, top, htop, nproc, hardinfo, hwinfo, dmidecode, getconf, inxi, lshw, and more, you can gather detailed information about your CPU, including its model, architecture, clock speed, cache size, and supported features. This knowledge is valuable for system optimization, troubleshooting, resource allocation, and software development. Choose the method that suits your needs and explore the capabilities of your CPU on Linux.
Conclusion
- Checking CPU information on Linux is crucial for understanding your system's hardware configuration and capabilities.
- The lscpu command provides a concise overview of CPU specifications, including the model, family, clock speed, and cache size.
- The cat /proc/cpuinfo command offers detailed information about each CPU core, such as the model name, vendor, cache size, and supported features.
- The top and htop commands provide real-time CPU utilization, load average, and core usage information.
- The nproc command quickly determines the total number of CPU cores without extensive specifications.
- Tools like hardinfo, hwinfo, dmidecode, getconf, inxi, and lshw provide comprehensive reports on CPU and system information.
- The cpufrequtils package allows the management of CPU frequency scaling settings.
- The sysfs filesystem provides access to CPU-related information, including current frequency and cache details.
- The i7z tool is designed for Intel Core i3/i5/i7 CPUs and provides detailed information about their features and status.
- The sysctl command lets you view and modify kernel parameters related to CPU information.
- Utilizing these methods and tools allows you to gather detailed CPU information for system optimization, troubleshooting, and software development purposes.
How to Check CPU Temperature on Linux
Link: https://phoenixnap.com/kb/linux-cpu-temp
Introduction
Like any electrical component, CPUs generate heat when being used. Some resource-demanding programs cause the CPU to increase the clock speed, which results in higher temperatures. Dust buildup also causes the CPU to overheat.
High temperatures shorten the lifespan of sensitive components, so keeping track of CPU temperatures is crucial. This way, you prevent performance throttling or component damage.
In this tutorial, you will learn how to use different tools and in-built utilities to check CPU temperature on Linux machines.
Prerequisites
- A machine running Linux
- An account with sudo/root privileges
Check CPU Temperature Using Lm-Sensors
Lm-sensors is a command-line utility for hardware monitoring. Use the tool to check the temperature of the CPU and other components. Follow these steps to install and configure Lm-sensors:
1. Open the terminal and install these packages using a package manager for your distribution. In Ubuntu, use the following command:
sudo apt install hddtemp lm-sensorsWait for the lm-sensors and hddtemp to finish downloading and installing.
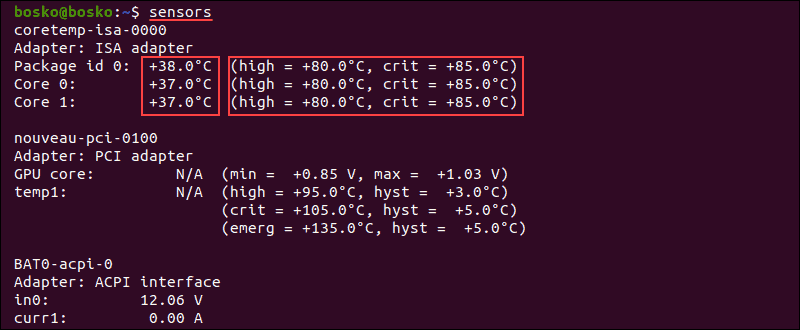
2. Execute the sensors command to see the CPU temperature. The output shows the current temperature readings of all sensors in the machine. The results include the temperature of each core and maximum thresholds.
3. To check SSD and hard drive temperatures, execute the following command:
sudo hddtemp /dev/sda
The output shows the temperature of the selected disk.
4. To see which system components you can monitor, run sudo sensors-detect.
Answer YES to multiple scanning requests until the system scan is complete.
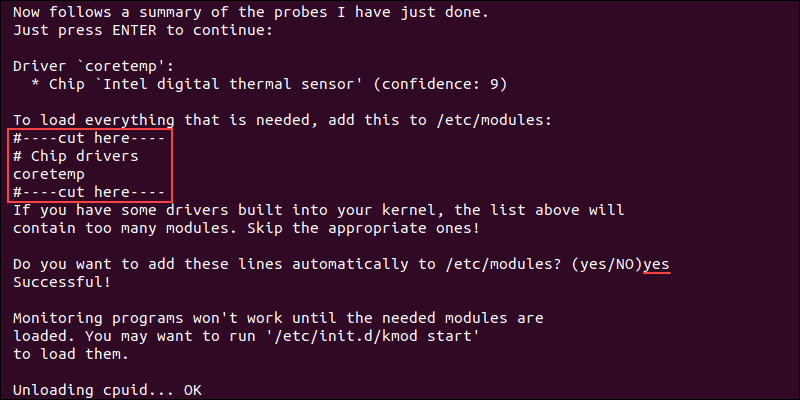
When the scan completes, the output shows the summary.
5. To ensure that system monitoring works, load the needed modules using the following command:
/etc/init.d/kmod start
6. To run the sensors command repeatedly and get real-time data in the terminal, execute the following command:
watch sensors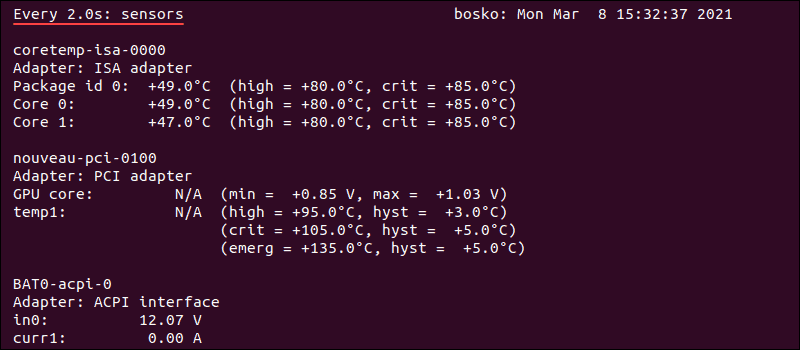
The output refreshes every two seconds and displays the current CPU temperature reading.
Note: To check CPU usage on Linux, read our tutorial on How to check CPU usage.
Check CPU Temperature Using Psensor
Psensor is a GUI app that allows you to monitor the temperature of various system components. This utility also allows you to monitor CPU usage and fan speed.
Psensor includes an applet indicator for Ubuntu, allowing you to display the temperature in the top panel to notify you when the temperatures get too high.
Install Psensor
Before installing Psensor, you need to install and configure Lm-sensors.
1. Run this command to install the necessary packages:
sudo apt install lm-sensors hddtemp2. Next, scan for sensors in your machine:
sudo sensors-detectAnswer YES to any scan requests until the scan is completed.
3. To make sure the packages are installed, execute the sensors command.
4. Update the package repository with sudo apt update.
5. Install Psensor using the following command:
sudo apt install psensor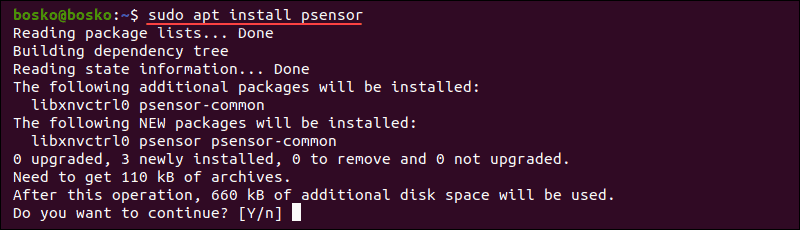
Answer YES and wait for the installation to finish.
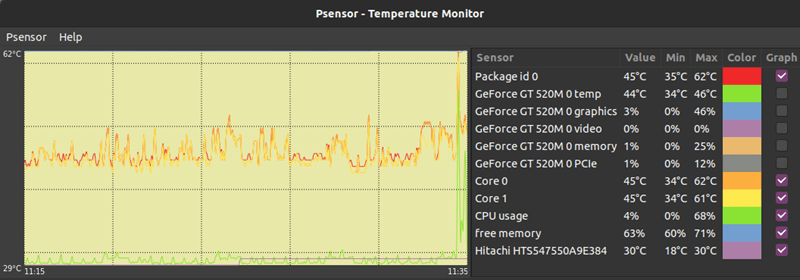
Using Psensor
Search for Psensor in the app menu and open the utility. The app displays a graph of the selected values and shows the CPU temperature, CPU and memory usage, free RAM, GPU temperature, and HDD temperature.
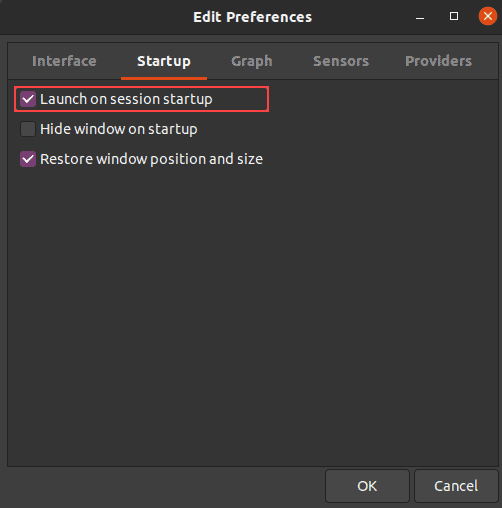
To configure Psensor and set which stats you want to see, follow these steps:
1. Click Psensor in the menu bar, followed by Preferences.
2. Check off the boxes for the options you want – whether Psensor launches on system startup, the update interval, graph colors, etc.
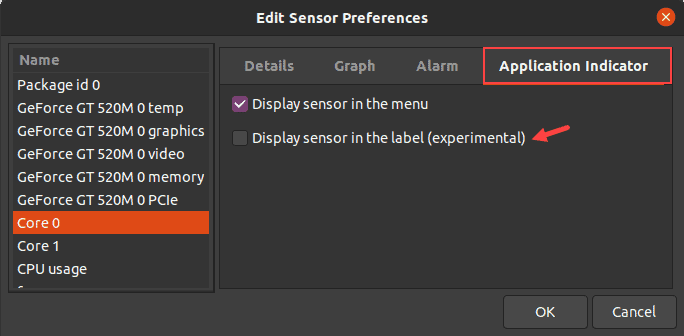
3. To show CPU or HDD temperatures in the top panel, go to Sensor Preferences under the Application Indicator. Enable the Display sensor in the label option.
Note: Learn more about monitoring CPU performance by referring to our article on Linux perf, a lightweight command-line utility.
Check Temperature Without Third-Party Utilities
There is a way to use the in-built utilities to check the CPU temperature if you don’t want to use third-party apps.
1. To check the CPU temperature without installing a third-party app, use the following command:
cat /sys/class/thermal/thermal_zone*/temp
The output shows the CPU temperature in the five-digit format. Here, 49000 means 49C.
2. If you get several thermal zones and different temperatures, execute the following command to see what a single thermal zone represents:
cat /sys/class/thermal/<thermal_zoneNumber>/typeFor example, run cat /sys/class/thermal/thermal_zone2/type to see the type of thermal zone 2.
The CPU temperature is in the zone labeled x86_pkg_temp.
3. To see what all the thermal zones are referring to, use:
paste <(cat /sys/class/thermal/thermal_zone*/type) <(cat /sys/class/thermal/thermal_zone*/temp) | column -s $'\t' -t | sed 's/\(.\)..$/.\1°C/'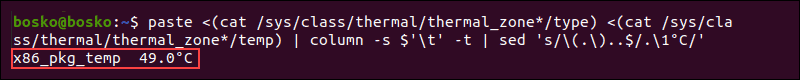
The output shows the last stored temperature for that thermal zone in degrees Celsius. In this example, there is only one thermal zone, labeled x86_pkg_temp, which represents the CPU temperature.
Conclusion
You now know how to check CPU temperature on Linux using various utilities. The guide also showed how to configure the tools to display other information, such as GPU and HDD temperature.
Comandos IPMITOOL
Link: https://wiki.joeplaa.com/applications#ipmitool
Installation
apt update && apt install ipmitoolConfiguration
Create a user with ipmi permissions only in Dell iDrac or HP iLO
Commands
https://www.tzulo.com/crm/knowledgebase/47/IPMI-and-IPMITOOL-Cheat-sheet.html
Get all sensor data
ipmitool -I lanplus -H <iDRAC IP> -U <iDRAC user> -P <iDRAC password> sdr list fullGet temperature(s)
ipmitool -I lanplus -H <iDRAC IP> -U <iDRAC user> -P <iDRAC password> sdr type TemperatureGet fanspeed(s)
ipmitool -I lanplus -H <iDRAC IP> -U <iDRAC user> -P <iDRAC password> sdr type FanOr
ipmitool -I lanplus -H <iDRAC IP> -U <iDRAC user> -P <iDRAC password> sdr get Fan1 Fan2 | grep "Sensor Reading"Get power supply info
ipmitool -I lanplus -H <iDRAC IP> -U <iDRAC user> -P <iDRAC password> sdr type 'Power Supply'Enable auto fan control / disable static mode (Dell)
ipmitool -I lanplus -H <iDRAC IP> -U <iDRAC user> -P <iDRAC password> raw 0x30 0x30 0x01 0x01Enable static fan control / disable auto mode (Dell)
ipmitool -I lanplus -H <iDRAC IP> -U <iDRAC user> -P <iDRAC password> raw 0x30 0x30 0x01 0x00Set fanspeed 20% (Dell)
See the script for other speeds. The last 4 characters differ.
ipmitool -I lanplus -H <iDRAC IP> -U <iDRAC user> -P <iDRAC password> raw 0x30 0x30 0x02 0xff 0x14Change system state
ipmitool -H <iDRAC IP> -U <iDRAC user> -P <iDRAC password> chassis power <status|on|off|cycle|reset>Recommended operating range for Core temperature
Coolers with 92mm fans are low-end to mid-range, which may be somewhat inadequate, since your processor's Thermal Design Power (TDP) is 120 Watts.
What is your ambient temperature? Normal or "Standard" room temperature is 22°C or 72°F, so high ambient temperature will adversely affect Core temperatures.
Although your Xeon X5460 has Thermal Specifications of Tcase 63°C and Tj Max 100°C, Tcase is not the limiting Thermal Specification; Tj Max is, which is the temperature that your processor will "Throttle" or reduce Core speed to prevent thermal damage.
Tcase is a misleading Specification because it's a factory only measurements on the surface of the Integrated Heat Spreader, so Tcase is not Core temperature, which is considerably higher. Further, Tcase is only relevant to the stock cooler.
Although 90°C Core temperature isn't quite hot enough to cause Throttling, it’s not advisable to push your CPU to the thermal limit, just as you wouldn't operate a vehicle with the temperature gauge pegged in the red “hot” zone.
If your hottest Core is within a few degrees of Throttle temperature, your CPU is already too hot. The consensus among highly experienced and well informed system builders and overclockers, is that cooler is better for ultimate stability, performance and longevity.
As such, all agree it's wise to observe a reasonable thermal limit below Tj Max. So regardless of your rig's environmental conditions, system configuration, workloads or any other variables, sustained Core temperatures above 80°C aren't recommended.
Here's the recommended operating range for Core temperature:
80°C Hot (100% Load)
75°C Warm
70°C Warm (Heavy Load)
60°C Norm
50°C Norm (Medium Load)
40°C Norm
30°C Cool (Idle)
Also, you might want to read this Sticky: Intel Temperature Guide - http://www.tomshardware.com/forum/id-1800828/intel-temperature-guide.html
O comando HTOP no Linux
Link: https://blog.ironlinux.com.br/o-comando-htop-no-linux/
- 17 de maio de 2022
Está com o seu servidor Linux lento e precisa de comandos para ajudar a descobrir o motivo? O comando htop pode ser um grande aliado na análise de processos e recursos.
O comando HTOP é um utilitário de linha de comando que tem como objetivo auxiliar o usuário a monitorar de forma interativa e em tempo real os recursos de seu sistema operacional Linux.
1| Instalar htop no Ubuntu
sudo apt install htop
2| Instalar htop no CentOS
sudo yum install htop
3| Iniciar a ferramenta
htop
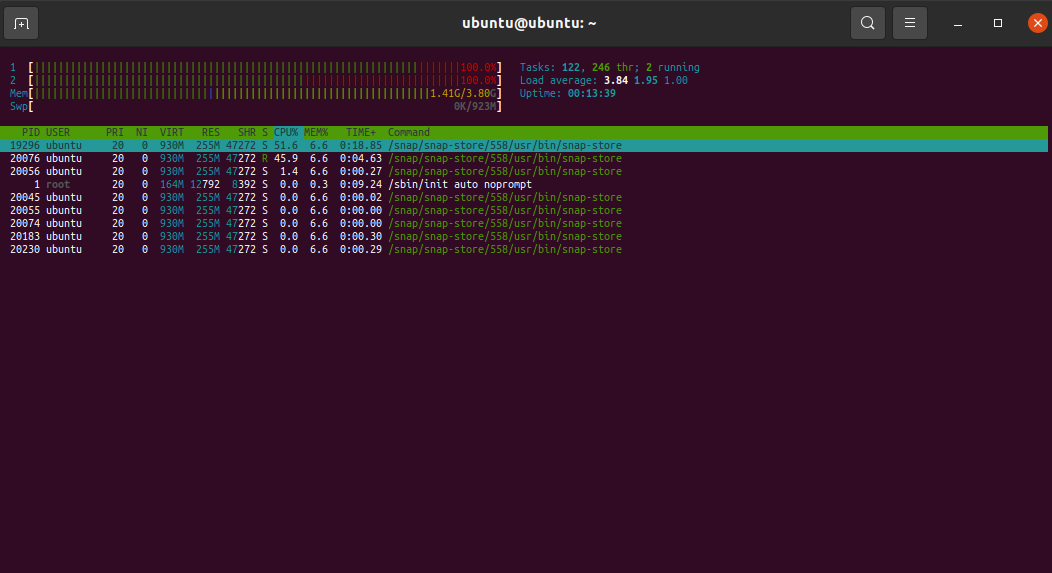
4| Visão geral da ferramenta
Ao digitar htop é apresentado a tela abaixo:

5| Explicando os blocos
Bloco superior

Bloco Inferior
Descrição dos Campos
| Campo | Descrição |
|---|---|
| PID | ID do processo |
| USER | Dono do processo |
| PRI | Prioridade do processo (Varia de 0 a 139, sendo que quanto menor mais prioridade) |
| NI | “Nices Values” afeta o valor da prioridade do processo (Varia de -20 a 19) |
| VIRT | Total de memória requerida pelo processo (não necessariamente está toda em uso) |
| RES | Quantidade de memória RAM que o processo está utilizando |
| SHR | Total de memória Compartilhada usada pelo processo |
| S | Estado atual do processo |
| CPU % | Percentual de tempo de CPU que o processo está utilizando |
| MEM % | Percentual de Memória RAM que o processo está utilizando |
| TIME + | Tempo de processador que o processo está utilizando |
| COMMAND | Comando que iniciou o processo |
5| Opções via CommandLine
O htop permite que você passe opções/ argumentos na execução dele para ajudar na análise
5.1| Delay
O comando htop muda as informações apresentadas rapidamente, pois os processos estão constatemente sendo atualizados. Com o comando abaixo o resultado é atualizado com o Delay (atraso) que você definir:
htop -d 15
O argumento acima tem o delay de 1 segundo, pois é calculado em décimo de segundo.
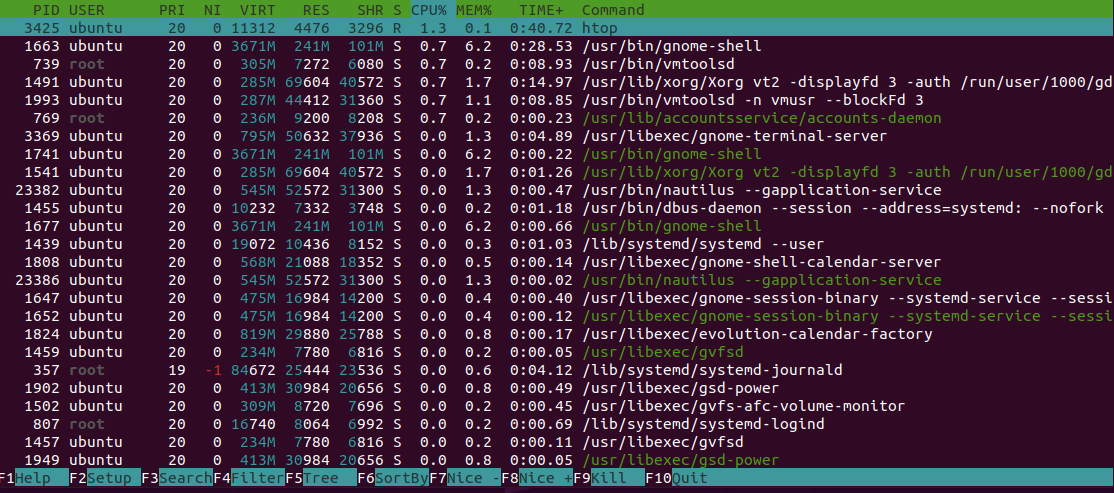
5.2| Filtro com PID
É possível filtrar com um determinado PID e exibir as informações deles
htop -p 1,19296
Conclusão
Assim como o gerenciador de tarefas no Windows, o comando htop é realmente muito poderoso e com certeza irá lhe ajudar na análise de qualquer caso.
Por fim, agradecemos a leitura e esperamos que este post tenha te ajudado de alguma maneira! Caso tenha alguma dúvida, entre em contato conosco pelo Telegram , Facebook ou Instagram ! Veja mais posts no IronLinux !